This is the written version of Three ways to predict things, taken from the lesson itself. The simulations, drag-and-drop activities and quizzes only work in the interactive lesson.
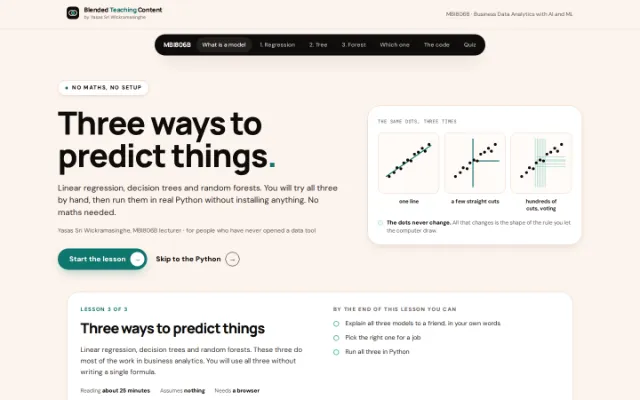
Linear regression, decision trees and random forests. These three do most of the work in business analytics. You will use all three without writing a single formula.
Reading about 25 minutes Assumes nothing Needs a browser
By the end of this lesson you can
- Explain all three models to a friend, in your own words
- Pick the right one for a job
- Run all three in Python
FirstWhat is a model?
Two minutes on the one idea all three share. Then we get to the models.
Normally, a person writes the rule. Someone at a bank decides: approve the loan if income is over $50,000. They typed that in. They can change it tomorrow.
A model works the other way round. You give it examples. It works out the rule itself.
Same three boxes, and the coloured one has swapped ends. That is the difference.
Why bother? Because some rules are too hard to write. Nobody can explain what makes a squiggle a 7 and not a 1. You just know. Show a computer a million squiggles and it works it out.
Two words you will keep seeing. The facts you have — size, visits, age — are the inputs. The thing you want to know is the answer. That is it.
Worth knowing
A model copies the past. If your old decisions were unfair, it learns to be unfair too — just faster. Nothing in this lesson fixes that.
Model 1 of 3Linear regression.
Use it when the answer is a number. How much will this flat rent for? How many will we sell?
Put your data on a chart. Draw one straight line through the dots. That is the whole model.
The line is the rule. Give it a new flat size, read the rent off the line.
Your turn
Twelve flats. Move the two sliders and get the line as close to all of them as you can.
Move the line
Get it as close to all twelve dots as you can.
How wrong the line is, in total $1,367
The best possible is $164. You are $1203 away.
Each dotted line is how wrong the line is about that flat.That was hard work. The computer does the same thing in a fraction of a second: it tries thousands of lines and keeps the one that misses least.
And look at what it found. About $6.70 for every extra square metre. That is not just a prediction — it is a sentence you can say in a meeting. That is why people still use this model.
It goes wrong when the dots make a curve
Ice cream sales climb with heat, then drop when it is too hot to go out. A straight line cannot do that.
And when you ask about something it has never seen
These flats are 28 to 98 square metres. Ask about a 400 square metre penthouse and it will still give you a number. It should not be trusted.
Where the name comes from: an 1886 study of how tall children turn out. It tells you nothing about what the model does. Everyone just calls it regression.
Model 2 of 3Decision tree
Use it when the answer is a choice. Will this customer cancel — yes or no?
Twist your ankle badly and you used to get an X-ray, almost automatically. Then some doctors in Ottawa wrote a short flowchart. Can you walk on it? Does this bone hurt? Answer those and you know if the X-ray is worth doing.
Hospitals that use it do far fewer X-rays and still catch the breaks. It is still on the wall today.
A decision tree is that flowchart, except the computer writes it.
How it picks the questions. It tries all of them and keeps whichever one splits the group best. Then it does the same again on each half.
A gym wants to ring people before they cancel. Here are fourteen members it already knows about. Which question should the tree ask first?
Which question should the tree ask first?
Filled square = cancelled · hollow circle = stayedGood: you can print it
Hand it to a nurse or a loan officer and every decision has a reason you can read out loud. In medicine and lending that is often the law, not a nice-to-have.
Bad: it memorises
You just saw this. Let it keep asking questions and it ends up with one branch per person.
The fix is one word
Stop it early. Three questions deep is plenty. In Python that is max_depth=3.
Model 3 of 3Random forest
Many small trees. Each one votes. The answer with the most votes wins.
One decision tree can be wrong.
So make lots of small trees. Ask every one of them. Go with the answer most of them give. That is a random forest.
Grow lots of small trees
Each tree asks its own question.
Ask every tree
Each tree says quit or stay.
Count the votes
Most votes wins: quit.
Your turn: ask the trees
The same gym. We want to know who will quit. Here are five tiny trees — each asks just one question, so you can read them. Pick a member and watch each tree vote.
Step 1 · Pick a gym member
Fay comes 3× a month joined 7 months ago
Step 2 · Each tree answers its one question
- Fay comes 3× a month → no
- Fay comes 3× a month → yes
- Fay joined 7 months ago → no
- Fay joined 7 months ago → yes
Step 3 · Count the votes
The forest says Fay will quit
Now check all 20 at once
We already know who really quit. So we can mark every tree, and the forest, on every member.
All 20 members · ✓ = the tree got them right · ✗ = wrong
| Member | Tree 1 | Tree 2 | Tree 3 | Tree 4 | Tree 5 | Forest vote |
|---|---|---|---|---|---|---|
| Amy | ||||||
| Ben | ||||||
| Cal | ||||||
| Dan | ||||||
| Eva | ||||||
| Fay | ||||||
| Gus | ||||||
| Hana | ||||||
| Ivy | ||||||
| Jay | ||||||
| Kim | ||||||
| Leo | ||||||
| Mia | ||||||
| Ned | ||||||
| Oli | ||||||
| Pia | ||||||
| Raj | ||||||
| Sam | ||||||
| Tia | ||||||
| Zoe | ||||||
| Got right | 13/20 | 15/20 | 15/20 | 15/20 | 16/20 | 19/20 |
Look down a column
Every tree has crosses. The best single tree gets 16 out of 20. The worst gets 13.
Now look across a row
The crosses land on different people. Most rows have more ticks than crosses, so the ticks win the vote. The forest gets 19 out of 20.
Find Dan’s row. 3 of the 5 trees got Dan wrong, so the vote went wrong too. When most trees are fooled, the forest is fooled.
The big idea: each tree makes mistakes, but on different people. When they vote, the right answers outnumber the wrong ones.
Why is it called a random forest?
Forest
Because it is lots of trees.
Random
Because each tree learns from a random handful of the data. So every tree comes out a little different — and makes different mistakes.
Above, we wrote the five questions by hand so you could read them. A real random forest does it for you:
Each tree learns from a random 12 of the 20 members
Filled dot = this tree gets to see that member · empty = it never sees themGood: it is right more often
One tree is easy to fool. It is much harder to fool most of them at the same time.
Not so good: it is hard to explain
You can read one tree. You cannot read 300. If you have to tell someone why, use one decision tree instead.
In Python you only choose how many trees
n_estimators=300 just means 300 trees. The computer grows them and counts the votes.
All three, side by sideWhich one do I use?
Usually decided by what you have to explain afterwards, not by which one scores highest.
Linear regression
One straight line through your data.
Can you explain it Yes — in one sentence
How accurate Fine, if the dots are roughly straight
Watch out for Curves. And questions outside your data.
Use it when The answer is a number and you want to know what drives it.
A flowchart of yes/no questions.
Can you explain it Yes — print the chart
How accurate Fine, if you stop it early
Watch out for Memorising your data instead of learning from it.
Use it when Someone will ask you to justify every decision.
Hundreds of trees. They vote.
What it answers A choice, or a number
Can you explain it No — 300 trees is not a chart
How accurate Usually the best of the three
Watch out for You cannot show anyone your working.
Use it when It mostly just has to be right.
Same twelve dots in all three pictures. Only the shape of the rule changes. “Usually the best” means exactly that — on a problem where the answer really is a straight line, the line wins.
Always try the simple one first. A line takes ten minutes and tells you whether there is anything in your data at all. If there is not, no forest will save you.
The codeSix lines of Python
You do not need to be a programmer. Every model is the same few lines, and we will read them together.
Here is a whole, real program. It trains a random forest on the 20 gym members you just met, then asks about two new people.
Press Next line to walk through it. Watch the picture underneath change as you go.
gym.py · a real program
Copy
Open Colab ↗- 1
from sklearn.ensemble import RandomForestClassifier - 2
- 3
# Inputs: [visits a month, months a member] - 4
X = [[1, 2], [1, 9], [2, 3], [2, 18], [3, 1], - 5
[3, 7], [3, 26], [4, 4], [4, 11], [4, 30], - 6
[5, 2], [5, 13], [6, 5], [6, 20], [7, 3], - 7
[8, 10], [9, 2], [9, 22], [11, 6], [12, 15]] - 8
- 9
# Answers: 1 = quit, 0 = stayed - 10
y = [1, 1, 1, 0, 1, 1, 0, 1, 1, 0, 1, 0, 1, 0, 0, 0, 0, 0, 0, 0] - 11
- 12
model = RandomForestClassifier(n_estimators=300) - 13
model.fit(X, y) - 14
- 15
new_members = [[2, 4], [10, 20]] - 16
print(model.predict(new_members))
Step 1 of 7Bring in the tool
scikit-learn is a free box of ready-made models. This line takes one model out of the box so the program can use it.
Word by word
from sklearn.ensemblefrom the part of scikit-learn that keeps the forestsimportbring inRandomForestClassifierthe random forest. Classifier means it picks between answers, like quit or stay.
Want to run it? Press Copy, then open a free Colab notebook, paste it into the box and press ▶. Colab already has scikit-learn, so there is nothing to install.
Swap one word, get a different model
Pick a model. Only the highlighted words change. The last two lines are the same for all three.
from sklearn.ensemble import RandomForestClassifierchangesmodel = RandomForestClassifier(n_estimators=300)changesmodel.fit(X, y)never changesmodel.predict(new)never changes
Use it when
The answer is a choice, and being right matters more than explaining.
The setting n_estimators=300
Grow 300 trees. More trees, steadier votes.
- 1 import the model
- 2 make it
- 3
fit— learn from examples - 4
predict— ask about someone new
Look inside: run it right here
scikit-learn hides the work inside fit. The three boxes below do that work by hand, in plain Python, so you can see it. They run in your browser — nothing to install.
Read each one line by line first. Then switch to Edit and run, change a number, and press Run.
The only Python you need for them
# a noteA note for people. Python skips everything after the #.size = 52Store a value under a name. Read = as “is now”.[28, 35, 41]A list: several values in order, inside square brackets.size[0]Pick one item from a list. Counting starts at 0, so this is the first.print("hello")Show something on the screen.f"Rent is {rent}"Text with a value dropped in. The f in front lets you put a name inside { }.for i in range(12):Repeat the lines under it 12 times, with i = 0, 1, 2 … 11.if visits < 4:Only run the lines under it when this is true. else: is what happens otherwise.def total_miss(…):Make your own command. return hands the answer back.(four spaces)The spaces at the start of a line matter. They show which lines belong together.
1 — finding the best line
# Twelve flats: how big they are (m²) and their rent ($ a month).size = [28, 35, 41, 46, 52, 58, 63, 70, 76, 84, 91, 98]A list of 12 flat sizes, in square metres.rent = [410, 430, 505, 520, 585, 600, 665, 690, 760, 780, 870, 880]Their rents, in the same order. The first flat is 28 m² and rents for $410.# How far does a line miss? Add up the gap for every flat.def total_miss(start, per_m2):Our own command. Give it a line — a starting price and a price per m² — and it adds up how far that line misses all 12 flats.miss = 0Start the total at zero.for i in range(12):Go through the flats one by one: i is 0, then 1, … up to 11.guess = start + per_m2 * size[i]What the line says this flat should rent for. * means “times”.miss = miss + abs(rent[i] - guess)How far off was that? abs drops any minus sign, so too high and too low both count.return missHand the total back.# 1. Try a line yourself. Change these two numbers.my_start = 200Your line: start at $200 …my_per_m2 = 7… and add $7 for every square metre. Change these two, press Run, and try to get the miss down.print(f"My line misses by ${total_miss(my_start, my_per_m2):.0f}")Show how far your line misses. The first $ is just a dollar sign; {…} drops the number in;:.0f means “no decimals”.# 2. Let the computer try 60,000 lines and keep the best one.best_miss = total_miss(my_start, my_per_m2)The best line so far. We start with yours.best_start = my_startbest_per_m2 = my_per_m2for start in range(150, 300):Try every starting price from $150 to $299 …for cents in range(500, 900):… and for each one, every price per m² from $5.00 to $8.99. 150 × 400 = 60,000 lines.per_m2 = cents / 100range only counts in whole numbers, so we count in cents and divide by 100.miss = total_miss(start, per_m2)if miss < best_miss:Does this line miss by less than the best so far?best_miss = missThen it is the new best. Remember it.best_start = startbest_per_m2 = per_m2print(f"Best line: ${best_start} + ${best_per_m2} per m²")This is what LinearRegression finds. It just uses maths to get there instead of trying every line.print(f"It misses by ${best_miss:.0f} in total")# 3. Use the best line to predict a new flat.print(f"A 65 m² flat -> about ${best_start + best_per_m2 * 65:.0f} a month")Predicting is just using the line: start + price per m² × 65.
Runs in your browser. Nothing is installed and nothing is sent anywhere.
Try this: change my_start and my_per_m2 and get your miss as low as you can. Can you beat the computer's $164?
2 — a tree picking its first question
# Fourteen gym members.# How often each one comes (visits a month)...visits = [1, 2, 2, 3, 3, 4, 4, 5, 6, 7, 8, 9, 11, 12]A list of 14 numbers, one per member. The first member comes once a month.#... and what really happened: 1 = cancelled, 0 = stayed.cancelled = [1, 1, 1, 1, 1, 1, 0, 0, 0, 0, 0, 0, 0, 0]The answers, in the same order. The first six cancelled.# Ask "visits less than cut_off?" and count the mistakes.def count_wrong(cut_off):Our own command. Give it a cut-off and it tells you how many members that question gets wrong.wrong = 0Start the mistake counter at zero.for i in range(14):Go through the members one at a time: i is 0 for the first, up to 13 for the last.if visits[i] < cut_off:The tree’s question. visits[i] is how often member number i comes.guess = 1 # yes -> guess "cancels"Yes side of the tree: we guess they cancel.else:guess = 0 # no -> guess "stays"No side: we guess they stay.if guess!= cancelled[i]:!= means “is not equal to”. Our guess does not match what really happened …wrong = wrong + 1… so add one mistake.return wrongHand the count back.# Try every cut-off. Keep the one with the fewest mistakes.best = 2The best cut-off so far. We start with the first one we will try.for cut_off in range(2, 10):Try cut-offs 2, 3, 4 … 9. range stops just before 10.print(f"visits < {cut_off} -> {count_wrong(cut_off)} of 14 wrong")Show the score for this cut-off. The f lets us drop numbers into the text with { }.if count_wrong(cut_off) < count_wrong(best):Fewer mistakes than the best so far? Then this one is the new best.best = cut_offprint(f"The tree's first question: visits less than {best}?")This is what DecisionTreeClassifier does for its first question — for every column, very fast.
Try this: does the winning cut-off match the question you picked in the tree widget above?
3 — five tiny trees, then a vote
# The same 20 gym members as the widget above.visits = [1, 1, 2, 2, 3, 3, 3, 4, 4, 4, 5, 5, 6, 6, 7, 8, 9, 9, 11, 12]Three lists, all in the same order. The first number in each belongs to Amy.months = [2, 9, 3, 18, 1, 7, 26, 4, 11, 30, 2, 13, 5, 20, 3, 10, 2, 22, 6, 15]answers = [1, 1, 1, 0, 1, 1, 0, 1, 1, 0, 1, 0, 1, 0, 0, 0, 0, 0, 0, 0] # 1 = quitWhat really happened: 1 = quit, 0 = stayed.# Five tiny trees. Each asks ONE question. True means "will quit".def tree1(i): return visits[i] < 3A tiny tree. For member number i it answers True (will quit) or False (will stay).def tree2(i): return visits[i] < 5def tree3(i): return visits[i] < 7def tree4(i): return months[i] < 6def tree5(i): return months[i] < 12Five trees, five different questions — the same five as Tree 1 to Tree 5 above.trees = [tree1, tree2, tree3, tree4, tree5]Put all five trees in one list, so we can go through them.# The forest: ask all five trees and count the "quit" votes.def forest(i):The forest is a command too. It answers for member number i.votes = 0Start the quit votes at zero.for tree in trees:Ask each tree in turn.if tree(i):Does this tree say quit?votes = votes + 1Then add one vote.return votes >= 3 # 3 or more of 5 say quit -> quitMost votes wins: 3 or more of the 5 means quit.# How many of the 20 does a model get right?def score(model):Give it any model — one tree, or the whole forest — and it counts how many of the 20 it gets right.right = 0for i in range(20):if model(i) == answers[i]:== asks “are these equal?”. Did the model guess what really happened?right = right + 1return rightfor n in range(5):Score each tree on its own …print(f"Tree {n + 1} on its own: {score(trees[n])} / 20 right")print(f"All five voting: {score(forest)} / 20 right")… then the forest. Compare the numbers.
Try this: change a cut-off in one of the trees, or change votes >= 3 to votes >= 2. The vote is hard to make worse — that is the useful part.
Stuck? Press Reset to get the original back. And while True: will freeze the page, because Python is running in this tab — just reload.
Quick quizThree questions
Nothing is saved and nobody sees it. Read why the wrong ones are wrong — that is the useful bit.
You want to predict how much a flat will rent for. Which model?
What this lesson saidFive things to remember
- 01 A model finds the rule for you. You give it examples. It gives you back a rule. Nobody types the rule in.
- 02 Linear regression draws one line. Use it when the answer is a number. It also tells you things like "about $6.70 per square metre".
- 03 A decision tree is a flowchart. Use it when the answer is a choice, and when you have to explain yourself. Stop it early or it just memorises.
- 04 A random forest is lots of trees voting. More accurate, but you cannot print it. Good when being right matters more than explaining.
- 05 Try the simple one first. A line takes ten minutes and tells you if there is anything there at all.
Sources: Galton's height study (1886); the Ottawa ankle rules (Stiell and colleagues, early 1990s).