This is the written version of Setting up Power BI, taken from the lesson itself. The simulations, drag-and-drop activities and quizzes only work in the interactive lesson.
Start hereThe three parts of Power BI
Instructions you find online rarely say which of the three they mean. Worth knowing the difference before you start.
Power BI Service
- Where app.powerbi.com, in any browser
- Who Everyone, on any operating system
The online half. Sign in, build reports, share them. Where the course starts, and where a Mac stays.
Power BI Desktop
- Where An application you install
- Who Windows only. No Mac version
The heavy end: full Power Query for reshaping messy data, deeper modelling, more connectors. Free. You publish finished work up to the Service.
Power BI mobile
- Where iOS and Android app
- Who Anyone, once a report exists
For reading reports somebody has already shared with you. You don’t author in it, so skip it for now.
Both routes end in the same place. A report you build in the browser is a real report, sitting in the same workspace Desktop would publish to.
Your setupPick your machine
Whichever you bring to class. Everyone works in the browser; Windows users have one extra thing to install.
Mac, Chromebook, iPad or LinuxYou’ll work in the browser.
Power BI Desktop is a Windows application. Microsoft has never shipped a Mac version and hasn’t announced one. The service itself runs as a web application, though, and works on your machine today with nothing to install — type in data, build reports, save them, reopen them anywhere. Every exercise in this guide works for you.
- 1 Open app.powerbi.com Any modern browser on any operating system. Safari, Chrome, Edge and Firefox all work. There is nothing to download.
- 2 Sign in with your student email The address your institution gave you. A personal Gmail or Hotmail won’t work — see the warning below.
- 3 Accept the free licence if prompted You may see "Start free" or a trial prompt. The free licence covers everything here — you get My Workspace and can build and save reports in it.
- 4 Find My Workspace In the left-hand navigation. It’s private to you until you deliberately share something.
A note on virtual machines
Other guides will tell you to run Windows on your Mac through Parallels or Boot Camp. Don’t bother. You’d be paying for and maintaining a second operating system to open one application. If you hit a point where the browser isn’t enough, come and ask me.
Read this before you sign in
Power BI sign-up needs a work or school email address. A personal Gmail, Hotmail or Outlook.com address gets refused, and the error doesn’t explain why. Use the address your institution issued you. If you’ve already tried with a personal one, sign out completely, close the tab, and start again.
Your first chartHello world
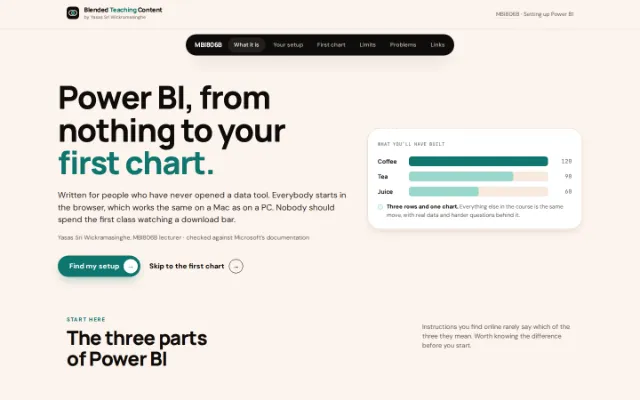
Three rows of made-up data and one chart. Try it here first, then do it for real in seven steps.
A mock-up of the report canvas, not Microsoft software. The panes sit roughly where Power BI puts them.
An empty visual, waiting for fields.
Power BI shows you this before you fill the wells.
Visualizations
Wells
Data
sales_by_itemYour table
| Item | Sales |
|---|---|
| Coffee | 120 |
| Tea | 90 |
| Juice | 60 |
Pick a field, then pick a well to put it in. Two fields is all it takes.
The real thing.
Same exercise in Power BI itself. Menu names below are the browser’s; where Desktop differs, it says so.
- 1 Go to My Workspace In the left navigation of app.powerbi.com. In Power BI Desktop, start a new report from the Home tab instead.
- 2 Choose New, then Semantic model Power BI’s name for the data a report sits on. Older menus call it a dataset.
- 3 Pick "Paste or manually enter data" Rather than connecting to a real source. In Desktop the button is called Enter data, on the Home tab.
- 4 Type two columns and three rows Item and Sales. Coffee 120, Tea 90, Juice 60. If you paste a header row, tick "Use first row as headers".
- 5 Load it, then create a report Your table now exists as a semantic model. Choose Create report next to it and the editor opens.
- 6 Add a bar chart and fill the two wells Click the bar chart icon in the Visualizations pane. Drag Item onto the axis and Sales onto the values. The chart draws itself.
- 7 Save it It lives in My Workspace, private to you, and reopens from any machine you sign in on.
About pasted data
Data you type in by hand is a snapshot, not a connection. There’s no way to refresh it, so to change it you re-paste or move to a file. It also caps out around 512 KB, with table names up to 80 characters and column names up to 512. Three rows won’t trouble any of that, but it’s why real work starts from a file or a database.
Browser vs DesktopWhat the browser can't do
It covers most of the course. Here's where it stops, so it isn't a surprise later.
| What you want to do | Browser | Desktop | Notes |
|---|---|---|---|
| Type or paste a small table and build from it | Yes | Yes | The exercise below. Same on both. |
| Upload an Excel or CSV file | Yes | Yes | Straight from your machine, either way. |
| Build reports, charts, slicers and pages | Yes | Yes | The report editor in the browser is the same editor. |
| Edit the data model, relationships and measures | Partly | Yes | The browser can edit models in a workspace; Desktop is more complete. |
| Reshape messy data with Power Query | No | Yes | The real gap. Merging, splitting, unpivoting, cleaning columns. |
| Connect to databases and the wider connector list | Partly | Yes | Desktop reaches far more sources, including a local SQL Server. |
| Refresh data you pasted by hand | No | No | Pasted data is a snapshot. Re-paste, or move to a file. |
| Share a report with somebody else | Partly | No | Sharing needs Power BI Pro. Building on your own is free. |
Power Query is the row that matters. If you’re on a Mac and we reach a point where we’re reshaping genuinely messy data, come and talk to me rather than buying anything.
TroubleshootingWhen it goes wrong
These six come up every year. Most of them aren't anything you did.
“We can’t find an account with that email”
You used a personal address. Sign out completely, then try your institution’s email.
“Your organisation doesn’t allow self-service sign-up”
An administrator switched it off. Email IT and ask for a licence. Nothing on your machine will fix it.
Signed in, but I can’t find My Workspace
Open the left navigation with the menu icon at the top. My Workspace is near the bottom of that list.
The Store says Power BI Desktop isn’t available
Your Windows build may be too old, or the Store is managed. Use the direct download, or work in the browser.
Power BI Desktop opens with big black areas
A Windows display-scaling problem. Search Windows for “blurry”, turn on “Let Windows fix apps that are blurry”, then restart it.
I’m stuck and class is tomorrow
Come anyway. It’s faster to fix in person.
LinksWhere to look things up
Microsoft changes the interface regularly. If a menu name here stops matching what you see, trust their documentation.
- Power BI Service The browser version. Start here, whatever you’re running.
- Power BI Desktop on the Microsoft Store The Windows install to prefer. Updates itself, no admin rights.
- Power BI Desktop direct download Windows, for when the Store is blocked. Choose 64-bit.
- Microsoft: download and install Power BI Desktop The official page, including the full system requirements.
- Microsoft: sign up for the Power BI service What each licence covers, and why sign-up sometimes fails.
- Microsoft: create a report in the service The same walkthrough in Microsoft’s words.
- Microsoft: getting started with Power BI Desktop For once you’re on Windows and past the basics.
- Power BI Essential Training, LinkedIn Learning A full video course, free through most institutional logins.
Take it with youSave these as notes.
A written summary of this page as a PDF: the explanations, tables and steps, without the interactive parts. Handy on a phone, or printed out.
Password to open it
Built here in your browser. Nothing is uploaded and no account is needed.
Extra reading only
A summary, not the primary lesson content. Your LMS holds the authoritative material, assessments, deadlines and announcements.
All rights reserved. For enrolled students, for personal study. Not for redistribution, re-upload to study-notes services, or training automated systems.
Your lecturerBring what you’ve got.
If you’ve got as far as a chart of three drinks, you’re set. If you haven’t, come anyway. An unsolved setup problem takes about five minutes in person, and I’d rather that than somebody sitting at the back unable to follow along.
Yasas Sri Wickramasinghe MBI806B lecturer