This is the written version of Welcome to business data analytics, taken from the lesson itself. The simulations, drag-and-drop activities and quizzes only work in the interactive lesson.
Decision-making frameworksHow a decision gets made
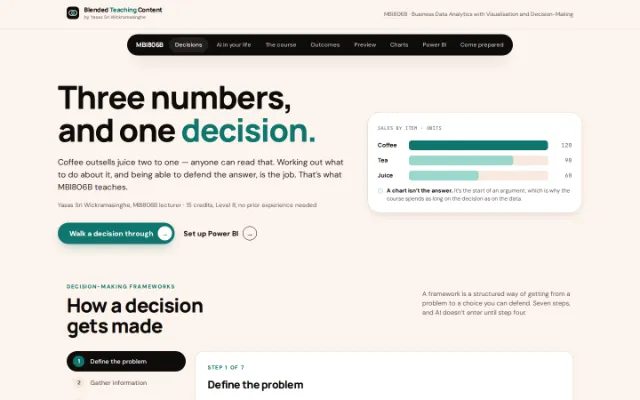
A framework is a structured way of getting from a problem to a choice you can defend. Seven steps, and AI doesn’t enter until step four.
Step 1 of 7Define the problem
Say clearly what the issue or opportunity is, and understand its context. Most bad decisions are answers to the wrong question.
AI in my lifeAI you already use
We open the course with this. Try a few, then bring one of your own to class — that’s the one we discuss.
None of these were programmed rule by rule. Each learned its behaviour from examples.
What this course isTurning data into a decision
15 credits at Level 8. No coding, statistics or prior AI experience assumed.
MBI806B builds on MBI805B, which you take alongside it, and needs MBI801 underneath. 150 learning hours: 36 in class, 114 on your own. You’ll pull insight out of business data using AI and machine learning, turn it into a visual that communicates something, and use that to make a decision — including on ethical and privacy grounds.
- MBI805B Co-requisite, same trimester
- MBI807B Business Intelligence and Data Warehousing
- 150 Learning hours: 36 in class, 114 yours
- 12 Topics across the whole course
- 4 Learning outcomes you are assessed against
By the end of the courseLearning outcomes
Word for word from the course descriptor. Everything you’re assessed on maps back to one of these four.
Decide with AI and ML
Evaluate advanced business data analytics techniques, including AI and ML algorithms, to make informed decisions within a business organization.
Use industry tools
Apply industry-standard business analytics tools to improve the efficiency and effectiveness of decision-making processes in a business context.
Visualise for an audience
Assess and apply different data visualization techniques to convey specific types of business information for an organization.
Judge it ethically
Critically evaluate business analytics practices from an ethical and data privacy perspective within a business context.
A small previewSome of what this covers
From the course material, in the order it’s taught. More than fits on one page.
What AI is
A definition that doesn’t need a computer science degree: if you’re dealing with a machine, by typing or talking, and it feels close enough to talking to a person that you can’t easily tell, that machine is behaving intelligently. The goal isn’t an all-powerful machine. It’s systems that behave in a human-like way, by communicating with us or, in robotics, by physically doing something.
What machine learning is
A program that learns to behave a certain way without anyone programming every rule, sometimes in ways its own creator didn’t predict. Three things make that work: data the program is given, a way of measuring how wrong it currently is, and a feedback loop that uses the error to improve next time. Nobody writes “if this, then that” — it works it out from examples.
How the two relate
Machine learning is one way of building AI: train a model on data until it can do a task. Every ML system is AI. Not every AI system uses ML.
All ML is AI. Not all AI is ML.
Where data science fits
The broader discipline: statistics plus computer science, applied to pulling meaning out of data. Four steps, whatever the question.
- 1 Gather data From internal systems, public sources, or third parties.
- 2 Clean and structure it Make sure it’s usable, complete and consistent, before you trust it.
- 3 Model and analyse it Use statistics and machine learning to explore patterns and test ideas.
- 4 Interpret the results Communicate what you found clearly enough that someone can act on it.
Four ways a machine learns
These four come up constantly, so get them straight early.
Supervised learning
You give it labelled examples — emails already marked spam or not spam — and it learns the pattern between them.
Unsupervised learning
No labels at all. It finds structure on its own, like grouping customers into segments nobody defined in advance.
Semi-supervised learning
A small batch of labelled examples plus a much larger pile of unlabelled ones. Useful when labelling everything by hand is too expensive.
Reinforcement learning
It learns by trial and error, taking a reward or a penalty for each action and adjusting to earn more reward over time.
Where this shows up in a business
Five areas, across almost every industry.
Customer experience
Chatbots and virtual assistants answer routine questions any time of day. Machine learning looks at what a customer has done before to recommend what they might want next.
Operational efficiency
Repetitive tasks like data entry get automated. Machine learning can predict when a machine is about to break down, before it actually does.
Data-driven decisions
Large volumes of business data get searched for patterns a person would never spot manually, then used to forecast what happens next.
Fraud and security
Banks and finance systems watch transaction patterns for anything unusual, and the system keeps getting better at spotting it as it sees more data.
Supply chains
Inventory levels, demand and delivery routes all get optimised, so a business can react faster and spend less doing it.
AI back in the decision
Data-driven decision-making means using analysis to find patterns instead of relying on gut feeling. The human still decides. They just decide with better information.
Predictive analysis
AI studies large datasets for patterns a person would take far too long to find, and forecasts what customers or markets are likely to do next.
Recommendation systems
The same idea that picks your next show or your next product suggestion, redirected at business decisions instead.
Decision support systems
In fields like finance, healthcare and logistics, AI surfaces the relevant data at the moment someone needs to decide something important.
A caveat
None of this is automatically safe to trust. The data has to be accurate, and someone still has to interpret what the algorithm says. As AI takes a bigger part in decisions affecting real people, bias, transparency and accountability matter. LO4 assesses exactly this.
LO3 · VisualisationWhich chart answers which question
One cafe’s year, five ways of drawing it. Pick a question and a chart, and see whether that pairing answers it, works but slowly, or quietly misleads.
Asking Which product brought in the most last quarter?
Column · Four products, Q4 only · revenue in $000s- Coffee
- Tea
- Juice
- Pastries
Answers it
What a column chart is for. Four bars sharing one baseline, longest wins, and you can see how far ahead Coffee is without reading a number.
1 of 20 combinations tried. Every question has at least one chart that answers it cleanly, and at least one that gets it wrong.
No chart is good or bad on its own, only good or bad for a question. That’s most of LO3, and it’s what gets marked: not whether the chart is pretty, but whether it answers what you claimed.
Across the whole courseThe full topic list
The indicative content from the descriptor. Twelve topics, building on each other.
- 01 Business decision-making with AI and ML
- 02 Data visualisation for business communication
- 03 Advanced data analysis with AI and ML
- 04 Risk management in AI/ML applications
- 05 Addressing data privacy and security risks in business analytics
- 06 Decision-making frameworks
- 07 Advanced visualisation techniques
- 08 Integrating findings and visualisations into decisions
- 09 Industry-standard business analytics tools
- 10 Advanced data analysis and predictive modelling
- 11 Ethical considerations in business analytics
- 12 Future trends in business data analytics
Our first toolSetting up Power BI.
A business intelligence tool. You point it at your data, build reports out of it, and share those with whoever needs them.
Power BI Desktop
A free application for building and designing reports. Windows only.
Power BI Service
The online side, at app.powerbi.com, for publishing, sharing and viewing reports in a browser.
Power BI mobile
For checking your reports and dashboards on the go.
Mac, Windows, or a laptop you cannot install on
Everybody starts in the browser at app.powerbi.com. It works the same on macOS as on Windows and needs nothing installed. Power BI Desktop is a Windows-only addition for later in the course. There’s a full setup guide on its own page.
Try it yourselfA hello world for Power BI.
No data source needed. Type in three rows by hand and build one chart from them. Works in the browser and in Power BI Desktop.
- 1 Go to My Workspace In the browser at app.powerbi.com. In Power BI Desktop, start a new report from the Home tab instead.
- 2 Choose New, then Semantic model A semantic model is Power BI’s name for the data a report sits on. Older guides call the same thing a dataset.
- 3 Pick “Paste or manually enter data” Rather than connecting to a real source. The Power BI Desktop equivalent is the Enter data button.
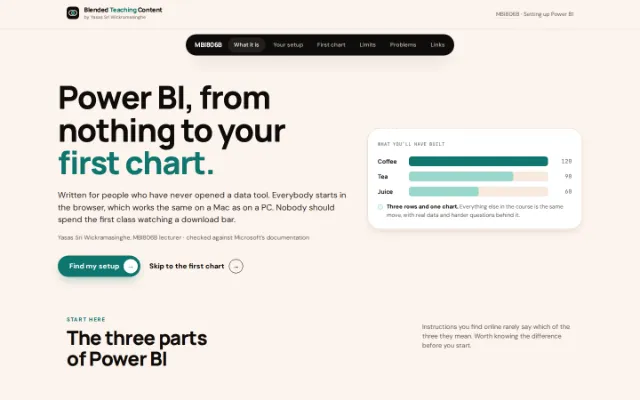
- 4 Type a small table Two columns: Item and Sales. Three rows: Coffee, 120; Tea, 90; Juice, 60.
- 5 Load it, then create a report Your table now exists as a semantic model. Choose Create report next to it and the editor opens.
- 6 Add a bar chart and fill the wells Click the bar chart icon in the Visualizations pane, then put Item on the axis and Sales on the values.
Three rows of made-up data and one chart. Everything later is the same move with real data. The setup guide has a practice version you can click through first.
Before classWhy bother, and what to bring
Nothing here needs buying. Mainly: turn up with a laptop.
Why it’s worth learning
- Increased efficiency Automating routine work saves time and money.
- Better customer experience Personalised, faster support keeps people satisfied and loyal.
- Better insights You understand your own operations and customers more deeply.
- A competitive edge Businesses that adopt early tend to out-innovate the ones that wait.
- It scales The same tools keep working as the business and its data grow.
Come prepared
- Bring a laptop With Power BI open in a browser if you can. The setup guide covers it on any operating system. If not, we’ll sort it out in class.
- No prior experience needed No coding, statistics or AI background assumed. Never opened a data tool? That’s the expected starting point.
- Bring one example One place you’ve noticed AI in your own life recently. We use these in the group discussion.
Take it with youSave these as notes.
A written summary of this page as a PDF: the explanations, tables and steps, without the interactive parts. Handy on a phone, or printed out.
Password to open it
Built here in your browser. Nothing is uploaded and no account is needed.
Extra reading only
A summary, not the primary lesson content. Your LMS holds the authoritative material, assessments, deadlines and announcements.
All rights reserved. For enrolled students, for personal study. Not for redistribution, re-upload to study-notes services, or training automated systems.
Your lecturerSee you in class.
None of the above needed a maths background, and neither does the course. If the Power BI setup gives you trouble, sort it out before the first class or bring it with you. Either is fine.
Yasas Sri Wickramasinghe MBI806B lecturer